https://medium.com/@skoli/using-realm-and-charts-with-swift-3-in-ios-10-40c42e3838c0#.x6dmb0ck4
Using Realm and Charts with Swift 3 in iOS 10
I have had few challenges when I was reading some tutorials of how to use Realm and Charts together. Mostly because all the tutorials that I have found was for Swift 2 and older versions of Realm and/or Charts.
So I decided to make a simple example project on GitHub and write down the steps taken. This is for me to remember better and hopefully helping someone else with the same problem.
About this tutorial
This tutorial starts from the beginning of making new project and it assumes that the reader has little knowledge already from the Xcode and Swift.
In this example we make simple app where you calculate visitors and add the current count to database with a date by pressing button. Then it will be shown in the chart right away.
Software used in this tutorial
Here is the list of the used software I used in this tutorial. If you don’t already have CocoaPods installed on your machine, please look the installation guide from below, because it’s needed to follow this guide.
- Xcode 8.0 (8A218a)
- CocoaPods (1.0.1) ( installation guide )
- RealmSwift (2.0.2)
- Charts (3.0.1)
- Your favorite text editor for editing Podfile ( I use Sublime Text )
Creating new project
Start your Xcode and create new Xcode project.
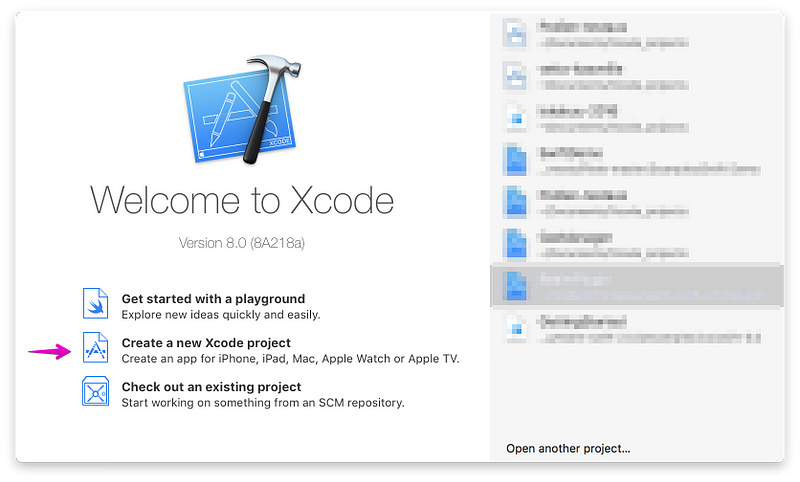
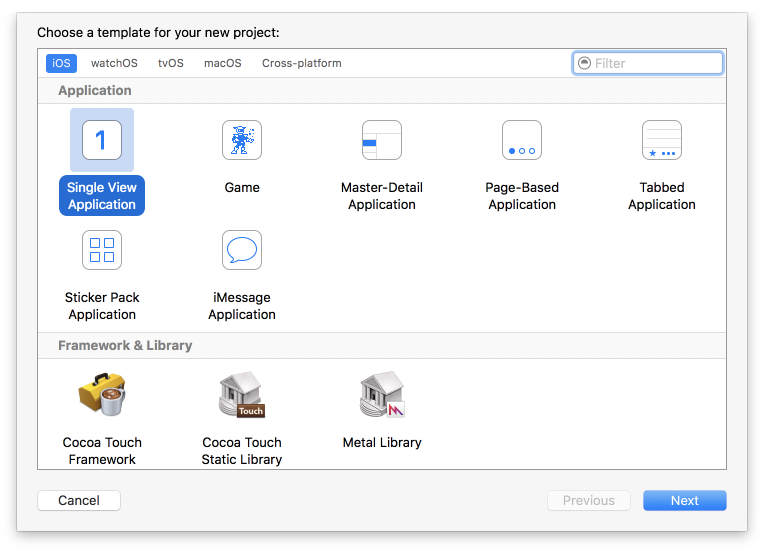
Then choose Single View Application and hit Next.
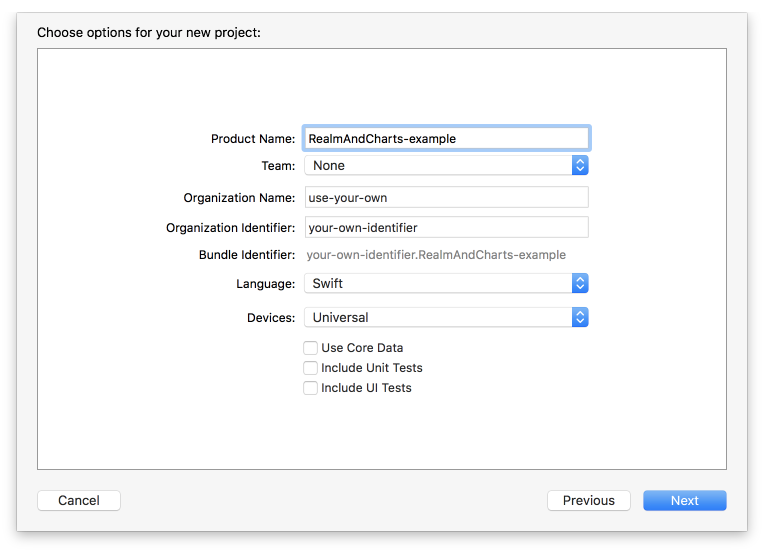
Now we set the options to our project. You can use whatever name you want to be Product name, Organization Name and Organization identifier. When you have filled the data as you desire, hit the Next.
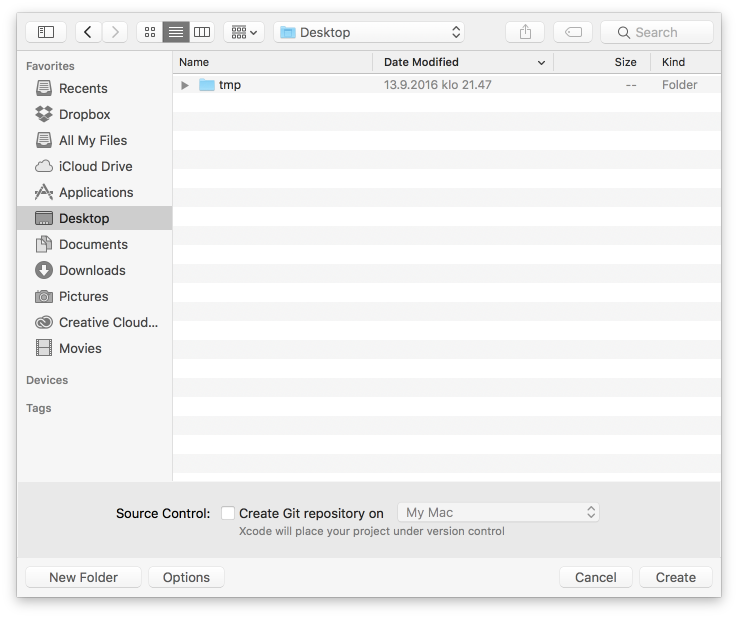
Next you are going to select the location for the project to be stored on your device. In this example I have selected the Desktop. Check Source Control if you like to make Git repository for the project.
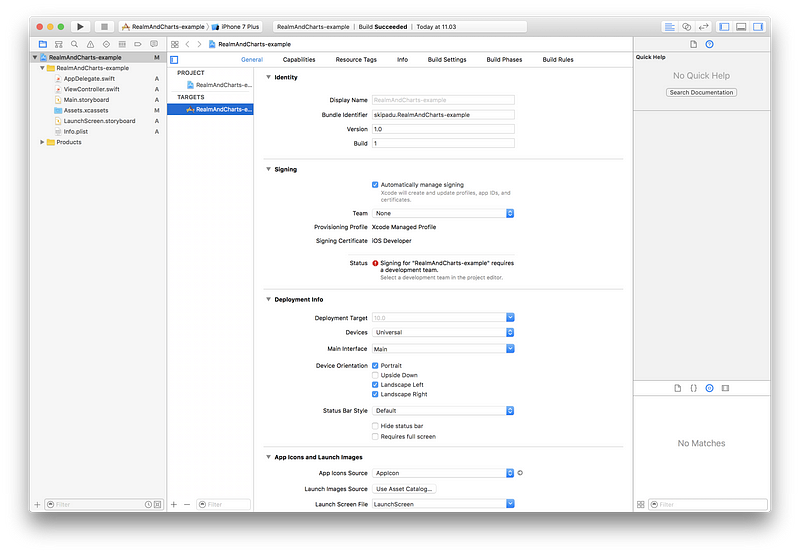
After this your project is created and you are shown a similar Xcode like this.
Now close the Xcode.
Using CocoaPods
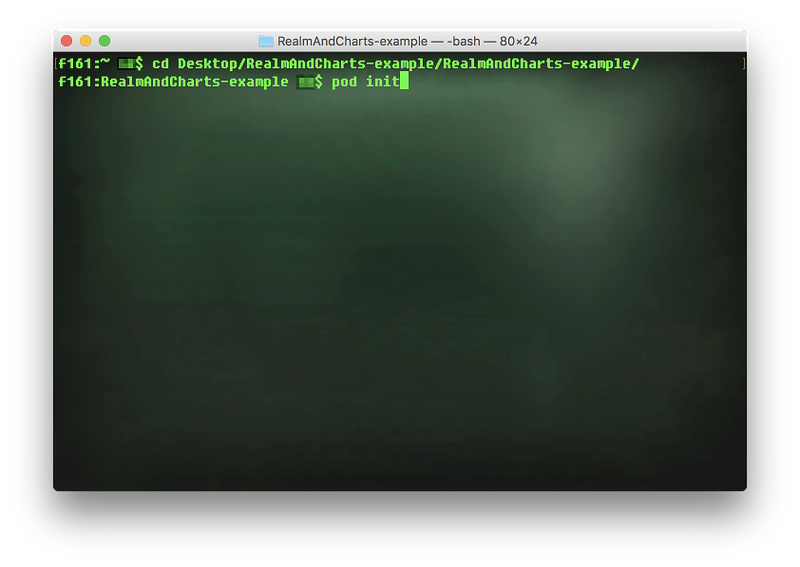
Next we are going to setup the CocoaPods for project. For this you have to open the Terminal and go to the folder you created the project. Because we did save the project in this tutorial to desktop we will write like this to the Terminal:
cd Desktop/RealmAndCharts-example/RealmAndCharts-example/
Now you are in the correct folder and we are ready to set up the CocoaPods. So write following command to Terminal.
pod init
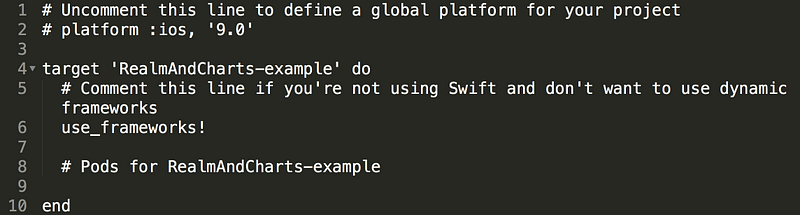
CocoaPods will generate a file named Podfile. Open it in your favorite text editor. It’s contents will look like in the following.
You need to add following pod, Charts, to the file.
pod 'Charts', '~> 3.0.1'
After that you want to add the RealmSwift to your podfile. So add following:
pod 'RealmSwift', '~> 2.0.2'
First is the name and then the version of it. It’s recommended to specify the pod version like this if possible when adding, so later when adding new pods it doesn’t get updated automatically to newest by you not knowing it. And sometimes this might get you to pulling hair out of your head, because you are not sure why it happened.
And you should also add the following to the end of your podfile. It’s from the Realm’s installation guide.
post_install do |installer|
    installer.pods_project.targets.each do |target|
      target.build_configurations.each do |config|
        config.build_settings['SWIFT_VERSION'] = '3.0'
      end
    end
  end
It will update the Swift version to 3.0 if needed in the code. And then Xcode shouldn’t nag for you to convert syntax to Swift 3 when you start it up next time.
Your podfile should now look like this:
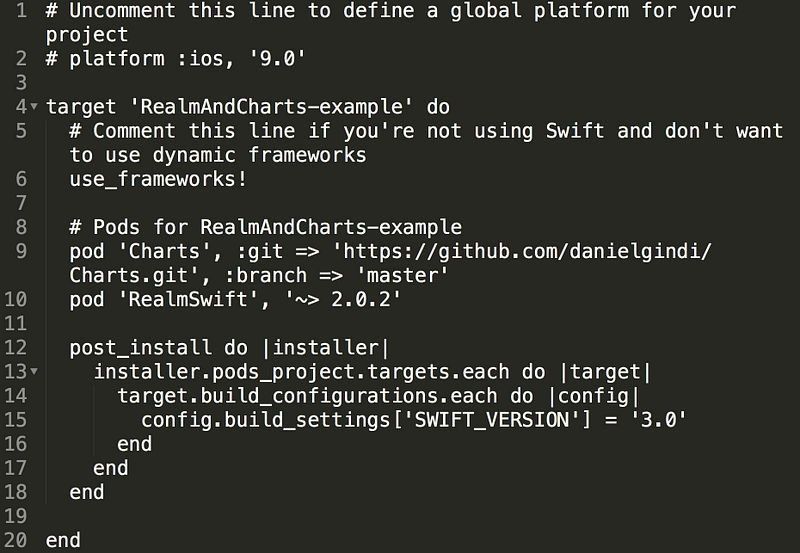
Then save the podfile and go to Terminal and write:
pod install
It will download the pods, installs them and make other needed changes. But you may experience error like this if your pods are not up to date:
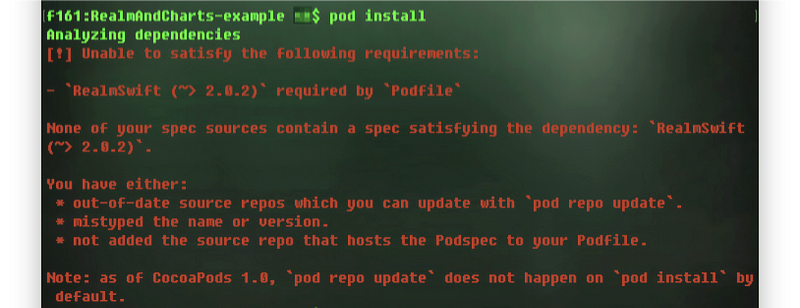
Then do as the error suggests, write:
pod repo update
It will then update to repository of CocoaPods and may take awhile. After it completes, try the pod install again. And now it should download pods nicely without a hitch.
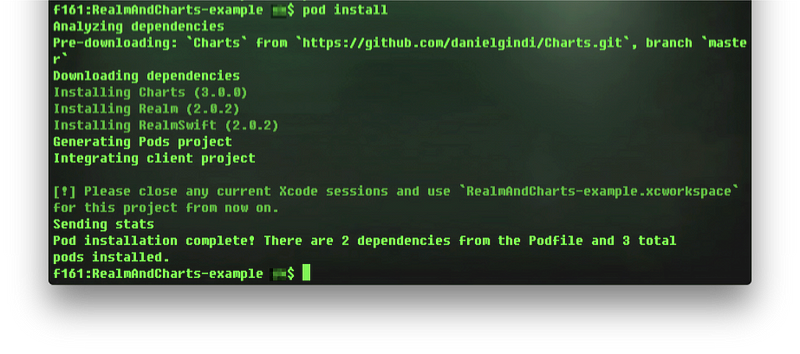
As it says in the Terminal CocoaPods have made a new file, RealmAndCharts-example.xcworkspace. You should now open project with that file from now on.
Open the workspace in Xcode
Get rid of warnings
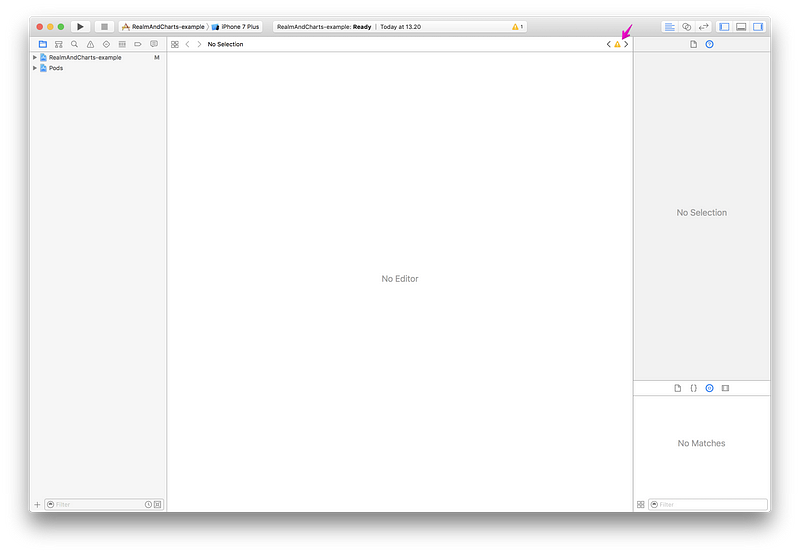
After you opened the workspace in Xcode, you notice that it has warning. Click it on the upper right corner, marked with red arrow in picture.
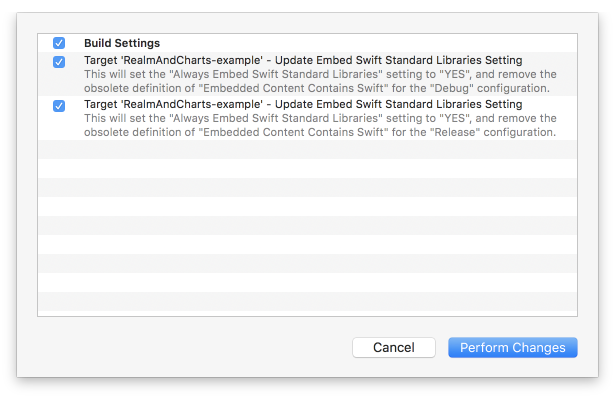
You are then show a similar dialog like below, hit Perform Changes -button.
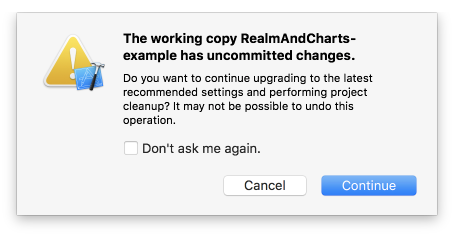
Then it does show following dialog if you have uncommitted changes in project, hit Continue.
After this is still might show same kind of warning icon, so click it again and now first dialog will differ a little from first one. Proceed like with the first warning and then you should no longer have warnings on your workspace regarding this same.
Then open the Main.storyboard.
Adding components to layout
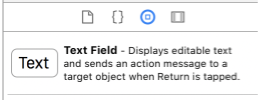
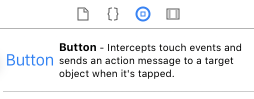
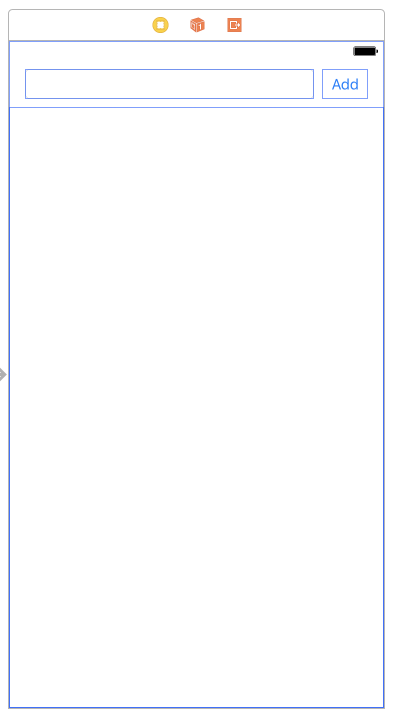
You need a way to add data to Realm database, so let’s start by adding textfield for value to be stored and a button which saves the item to database. You can add them as you like, which you see fits the best.
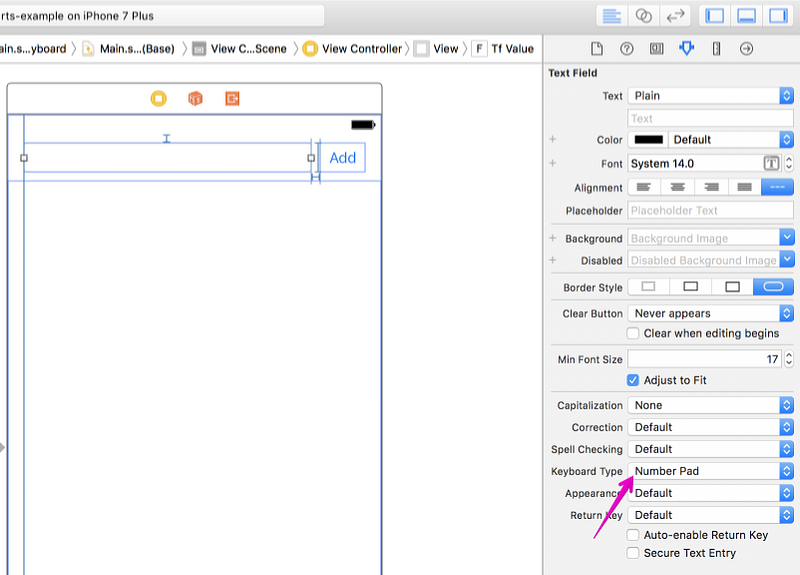
Choose the textfield and change Keyboard type to be Number pad from Attributes inspector. Then user can only enter numbers to our field, which suits our purpose more than better.
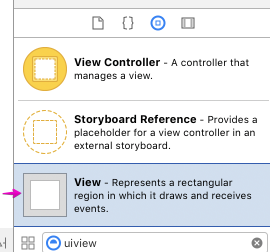
You should add also View to your storyboard. That will be used to show the chart with the example data.
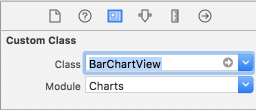
While you have selected the View component, go to Identity Inspector page and change the Class to be BarChartView.
This is how I put those to layout:
Creating outlets
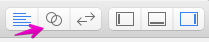
Now you need to make the outlet for the textfield and view. First show the assistant editor by pressing the button for it in the top-right corner of Xcode:
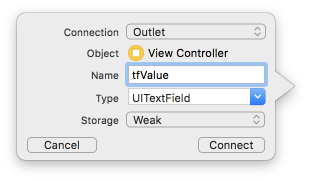
Then press Control button and drag from the textfield to code. When you release the mouse button, you get the dialog. Name it tfValue and hit Connect.
Then do also the outlet for the View to the code. Name it barView. It will show error for the outlet because we have not imported the Charts pod yet.
Add the import clause just under the UIKit, so then your imports are like this:
import UIKit
import Charts
And press Command + B to build the workspace to get rid of the error.
Remember to connect the button
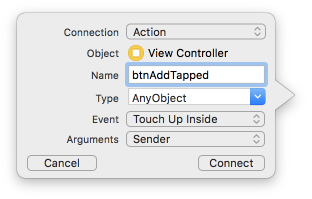
You need to make the button work, so create action for it. It is almost like doing outlet, but choosing Action from the dropdown.
Then we are going to make it do some work for you.
Taking RealmSwift in to equation
You are going to need an class which you are saving to Realm database. In this example we make a class, VisitorCount, for that purpose.
So make a new Swift file and write the code to look like this:
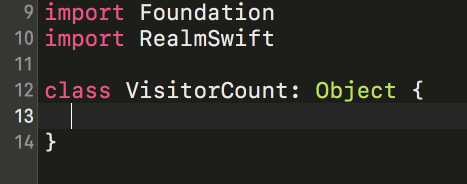
It’s superclass is Realm’s Object and then Realm knows how to store it in the database. In this example we only add two fields for it; date for the time of record and field for the visitor count value.
dynamic var date: Date = Date()
dynamic var count: Int = Int(0)
Then you should told somehow to this object to save it to database. This can be done also in many other ways, but in this example we do it this way.
func save() {
  do {
    let realm = try Realm()
    try realm.write {
      realm.add(self)
    }
  } catch let error as NSError {
   fatalError(error.localizedDescription)
  }
}
You will use this method little later when adding the visitor count to database by clicking the Add button. It will open the connection to Realm and write this object to it. If any error arises, we catch it.
Now when you have the VisitorCount class ready, let’s use it when tapping the button.
Action for the button
Open the ViewController.swift and then go to the function you created for the button. Write some code, so it will look like this:
@IBAction func btnAddTapped(_ sender: AnyObject) {
  if let value = tfValue.text , value != "" {
    let visitorCount = VisitorCount()
     visitorCount.count = (NumberFormatter().number(from: value)?.intValue)!
     visitorCount.save()
     tfValue.text = ""
  }
}
We are checking that the textfield value is not empty. And if it’s not empty, we create new VisitorCount object and parse the value currently as string to be integer value. Then we save it to Realm database and clear the textfield to be ready for next value.
Showing data on chart
We now have a way to add visitor counts to database, but we are not able to show them yet. So that will be our next step.
First, add import for RealmSwift, by adding it under existing imports. We need that soon and when adding the needed import now we don’t get the error of missing import. Of course you can write the code first, but then Xcode can’t assist you when writing code because it doesn’t know how.
import RealmSwift
In your viewDidLoad -function make call to a new function that we are going to do.
override func viewDidLoad( {
  super.viewDidLoad()
  updateChartWithData()
}
Then we are going to create the function we are calling. It is used to update the data that is seen on chart.
func updateChartWithData() {
  var dataEntries: [BarChartDataEntry] = []
  let visitorCounts = getVisitorCountsFromDatabase()
  for i in 0..<visitorCounts.count {
    let dataEntry = BarChartDataEntry(x: Double(i), y: Double(visitorCounts[i].count))
    dataEntries.append(dataEntry)
  }
  let chartDataSet = BarChartDataSet(values: dataEntries, label: "Visitor count")
  let chartData = BarChartData(dataSet: chartDataSet)
  barView.data = chartData
}
And here is the other method which only fetches the database records and it’s used in the updateChartWithData -function.
func getVisitorCountsFromDatabase() -> Results<VisitorCount> {
  do {
    let realm = try Realm()
    return realm.objects(VisitorCount.self)
  } catch let error as NSError {
    fatalError(error.localizedDescription)
    }
}
We also want to update the chart right away after we have added new visitor count, so let’s call the update function also from btnAddTapped -function:
@IBAction func btnAddTapped(_ sender: AnyObject) {
  if let value = tfValue.text , value != “” {
    let visitorCount = VisitorCount()
    visitorCount.count = (NumberFormatter().number(from: value)?.intValue)!
    visitorCount.save()
    tfValue.text = “”
  }
  updateChartWithData()}
Trying the app for the first time
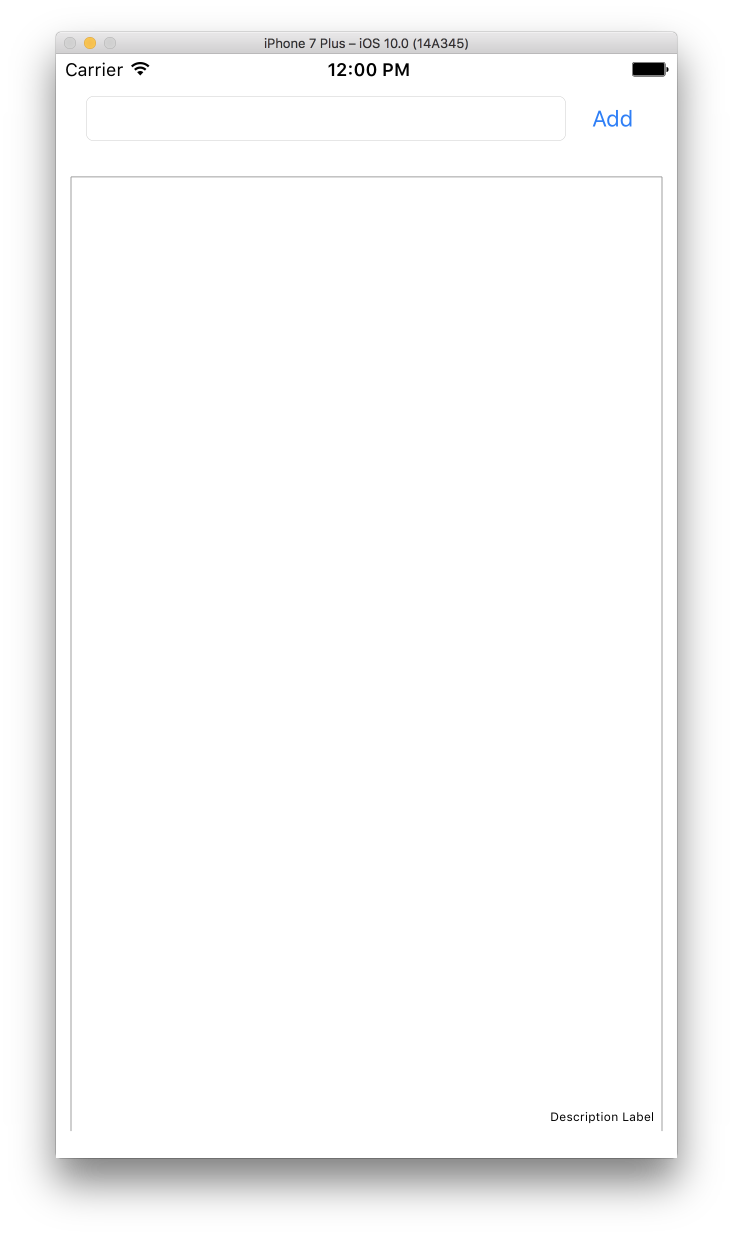
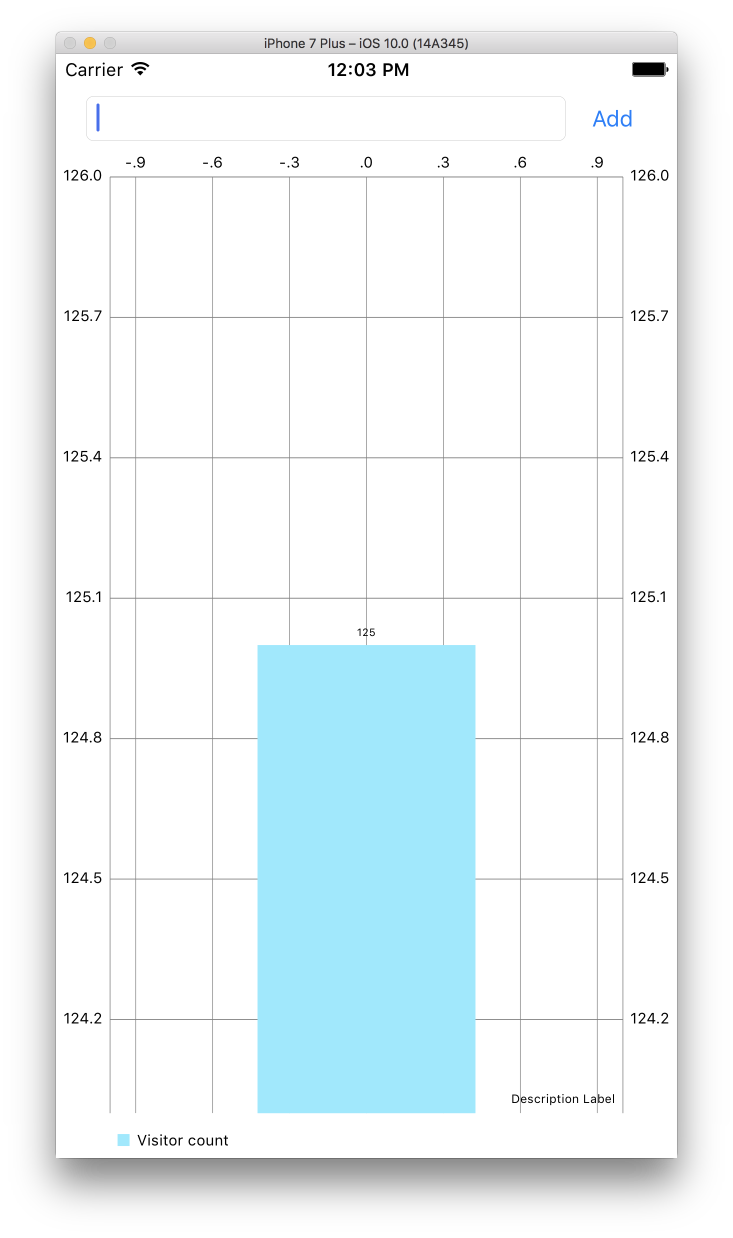
Now when we should have all the functions ready, let’s start the app in the simulator and test it out. Hit Command + R to run it on your selected simulator. You then see the app like following. As you can see, there is the text Description Label on the lower right corner by default, we are not interested in that.
Now add visitor count to textfield and hit Add. I test it with number 125. And then it will look like this.
Congratulations for showing the first data in your chart! Now try adding more data if you like, so you can see how the chart will adjust itself. Here is my random visitor counts added:
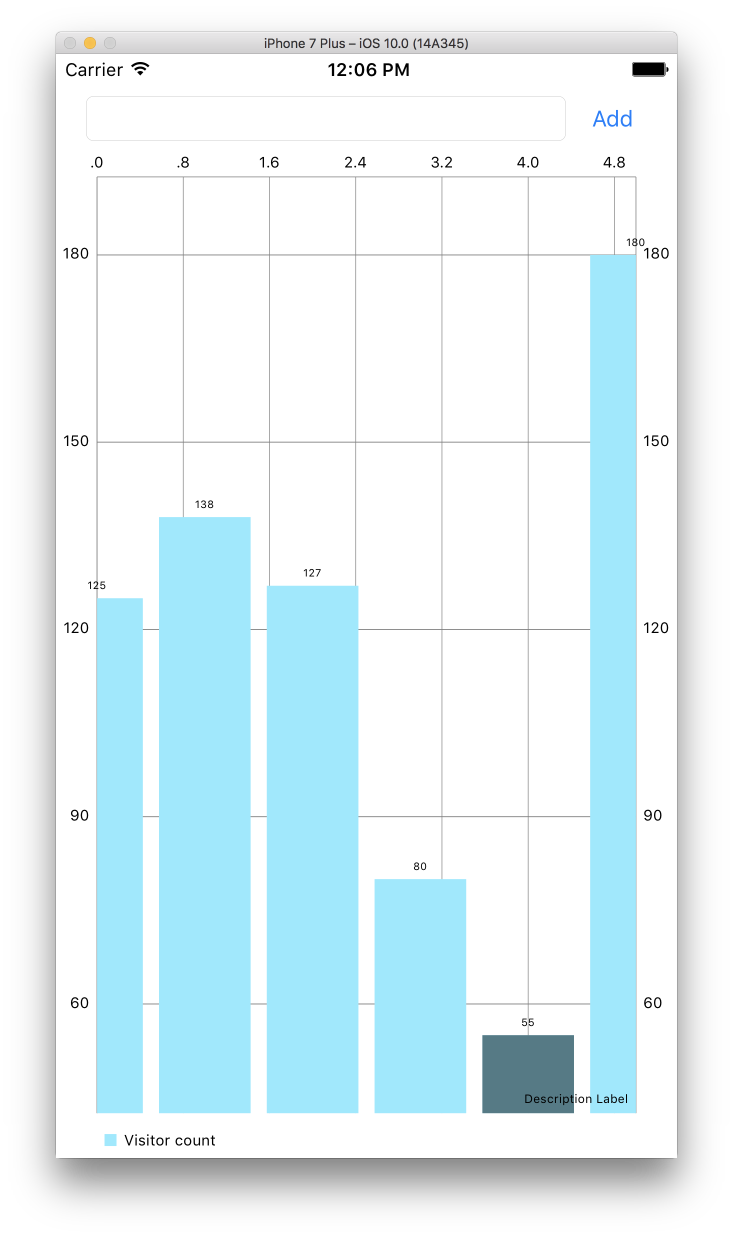
But wait a moment! What in the world is in the X-axis? They are just double values but not the dates we want! That is because we haven’t used the date we added to VisitorCount object! We like to have it in following format, e.g: “HH:mm.ss” = 18:34.20. So let’s make it happen.
Setting date in X-axis
First, we need to present delegate where are telling different implementation than what it is doing by default.
Just under the outlets you did for textfield and value, we add this delegate variable.
class ViewController: UIViewController {
  @IBOutlet weak var tfValue: UITextField!
  @IBOutlet weak var barView: BarChartView!

  weak var axisFormatDelegate: IAxisValueFormatter?
Then on your viewDidLoad we need to tell to delegate that the implementation is in this class, ViewController.swift.
override func viewDidLoad() {
  super.viewDidLoad()
  axisFormatDelegate = self

  updateChartWithData()
}
And we need to change the current way of setting the X-axis’ value. So head to updateChartWithData() -function and make few changes in it.
Because Charts seems to like to have it’s X-axis value as Double, we need to make our date to be compatible with it. We do this by making TimeInterval from the date and set that to X-value.
Then we also set the custom formatter to our X-axis, which we are implementing little later. This will tell chart how to show the data in X-axis.
It should look like this after the modification:
func updateChartWithData() {
  var dataEntries: [BarChartDataEntry] = []

  let visitorCounts = getVisitorCountsFromDatabase()

  for i in 0..<visitorCounts.count {
    let timeIntervalForDate: TimeInterval = visitorCounts[i].date.timeIntervalSince1970
    let dataEntry = BarChartDataEntry(x: Double(timeIntervalForDate), y: Double(visitorCounts[i].count))
    dataEntries.append(dataEntry)
  }
  let chartDataSet = BarChartDataSet(values: dataEntries, label: "Visitor count")
  let chartData = BarChartData(dataSet: chartDataSet)
  barView.data = chartData

  let xaxis = barView.xAxis
  xaxis.valueFormatter = axisFormatDelegate
}
Then go to end of the whole file and outside the braces, we make an extension for ViewController, where we do implement for IAxisValueFormatter. It will be used to show dates in X-axis.
Here we are making the opposite than we did before with the date; now we convert it back to date from the Double format. Then it’s easier to format as string when using DateFormatter.
// MARK: axisFormatDelegate
extension ViewController: IAxisValueFormatter {

  func stringForValue(_ value: Double, axis: AxisBase?) -> String {
    let dateFormatter = DateFormatter()
    dateFormatter.dateFormat = “HH:mm.ss”
    return dateFormatter.string(from: Date(timeIntervalSince1970: value))
  }
}
After you have wrote the needed code, it’s time to run the app once again.
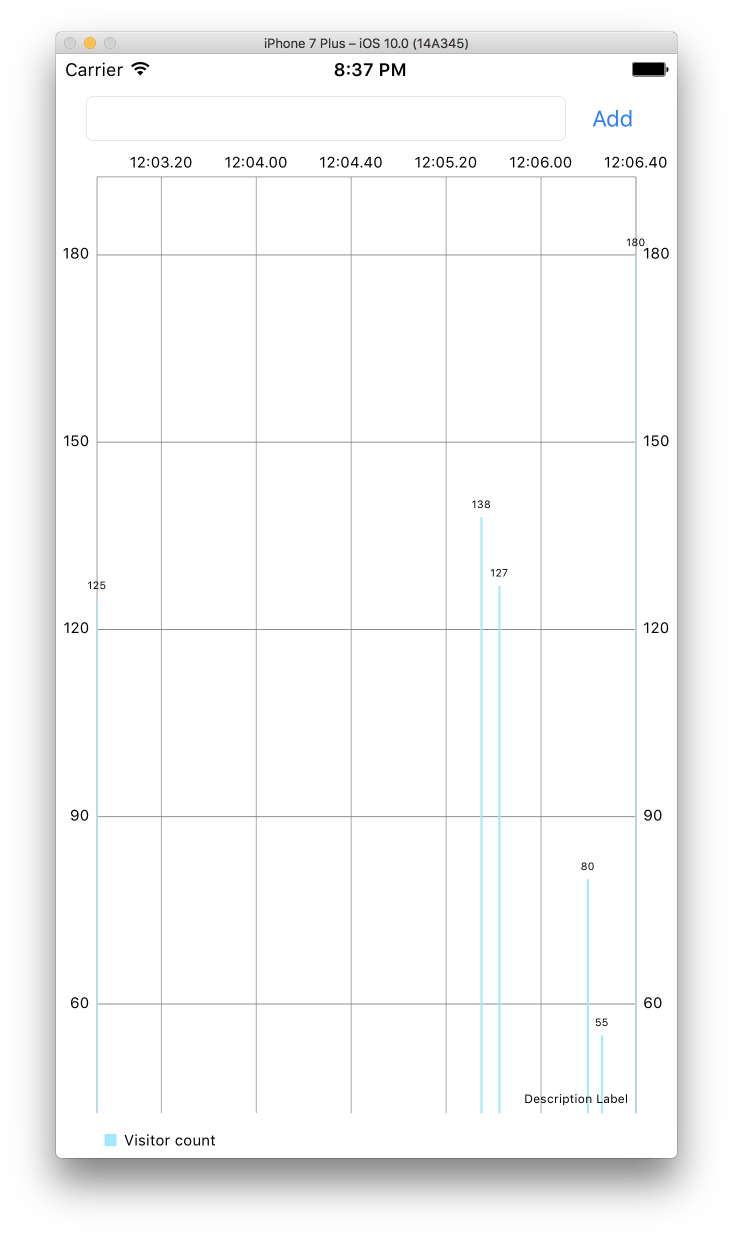
Now our app has dates in the X-axis. So we are done for now.
Final words and what to do next
Now you should have little more knowledge how to use Charts and RealmSwift in your project. You can learn more about those on their own page and expand the functionality of the example app.
Here is few ideas what to expand / change
- Add ability to remove data
- Change formatting of dates on X-axis
- Change colors in chart
- Change to different kind of chart (LineChart maybe?)
- Change the Description label to your own liking
Sources
Here is the link to the source code that was written in this tutorial
Here are the sources that I used to gather the information.
Thanks for reading!
Updated 20th October 2016: Fixed quotation marks on the Podfile. Medium seems to have changed them automatically when copy-pasting from file.
Updated 7th January 2017: Updated the pod file configuration for Charts. No more need to tell certain branch like previously.